Shiny demos of rPref functions
Here we demonstrate some rPref functions by means of Shiny apps. They can be directly run in RStudio if the Shiny package is installed. Some of these demos also require the ggplot2 package. All packages needed for the following demos can be installed with
install.packages("shiny")
install.packages("ggplot")
install.packages("rhandsontable") # only needed for the SVM demo
The apps can be directly downloaded and run with the commands given subsequently using RStudio with installed Shiny package. Alternatively, you can download and extract the zip archive, open one of the files (server.r or ui.r) in RStudio with installed Shiny, and click on "Run App".
Level selection in rPref
The Pareto-optimal set is defined as the Level-1 points. The Pareto optima of the remainder are the Level-2 points. The optimal points of the k-th remainder are the Level-(k+1) points. The different levels are visualized in the following Shiny app.

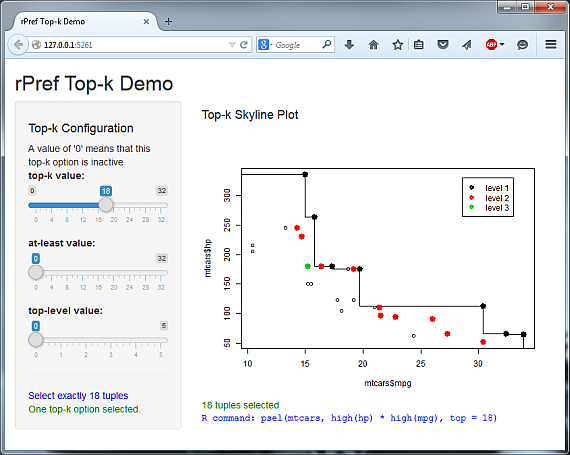
Top-k interface of rPref
There are three different top-k parameters for the preference selection in rPref: top, at_least and top_level. This app visualizes the effects of the different top-k selections. Each slider represents one of the top-k parameters and can be separately adjusted, where a value of "0" means that this top-k parameter is inactive. If more than one parameter is active, the connection operator (intersection or union) between them can be chosen.
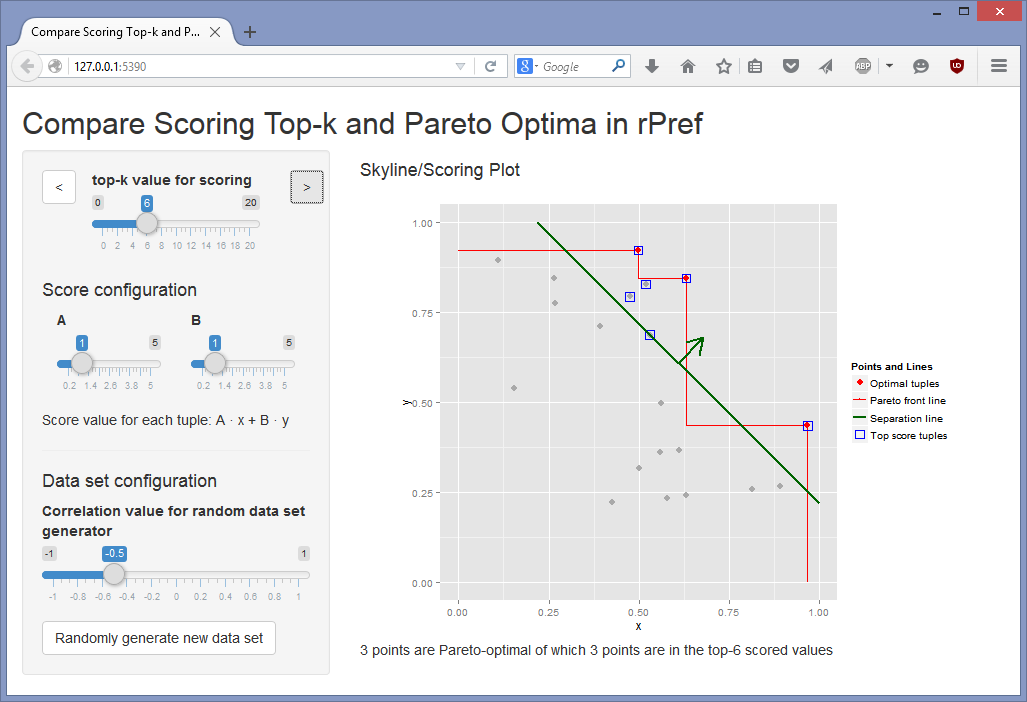
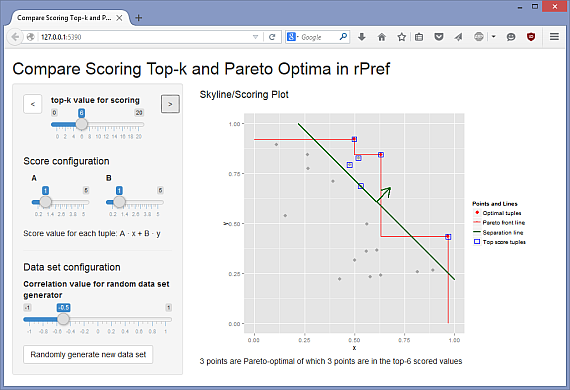
Preferences vs. Scoring
In this app we compare preferences with linear scoring. The top-k selection for a linear scoring function is defined by the k first points (x,y) of the data set, when ordered by A · x + B · y descendingly. The data set is synthetically generated and consists of 20 points in [0,1]2 with a given correlation value. The Pareto front, maximizing the both dimensions, is also given and can be visually compared to the scoring approach.
Support vector separation of Pareto optima
This app allows to separate the Pareto optima from the Level-n points by a separation line of a Support Vector Machine (SVM). Similar to the "Preferences vs. Scoring" app, we have 20 points with a correlation value given by the user. Alternatively, the points can be manually edited using the "tuple editor", implemented using the rhandsontable package.
If the separation is possible, then a maximal corridor between the optima and the level-n points is established and the formula is given. If no separation is possible, the error distance is returned. We see that the separation gets more difficult for higher anti-correlation values.
